Motion and Time
Motion
- Motion refers to the change in the position of an object with respect to time.
- There are two states of an object:

- When a body does not change its position with respect to time, then the body is said to be at rest.
Examples: Chairs of a dining table, a flower vase, table, blackboard etc.
- When the body changes its position with respect to time, then the body is said to be in motion.
Examples: The blades of a rotating fan, the hands of a working wall clock etc.
Slow and Fast Motion
- An object is said to be moving slowly if it covers lesser distance in a given time interval.
- A slow moving object has low speed.
- An object is said to be moving quickly if it covers more distance in a given time interval.
- A fast moving object has high speed.
Rectilinear Motion
- Motion in a straight line is called rectilinear motion.
Circular Motion
- When an object moves in a circular path, it is said to perform circular motion.
Rotational Motion
- When an object turns/spins about a fixed axis, it is said to perform rotational motion.
Periodic Motion
- The motion which repeats itself after regular intervals of time is called periodic motion.
- It is also called oscillatory motion
Speed
- Speed is the distance covered by an object in unit time.
- If a body covers equal distances in equal intervals of time, then it is said to be moving with uniform speed.
- If a body covers unequal distances in equal intervals or equal distances in unequal intervals, then it is said to be moving with non-uniform speed.
- Speed is calculated as

- The basic unit for speed is metre per second (m/s).
- It is also measured in kilometre per hour (km/h) and kilometre per min (km/min).
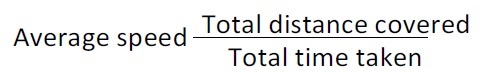
Average Speed
- The average speed of a moving object is defined as the total distance covered by it divided by the total time taken.
Measurement of Speed
- Speed is how fast or slow an object is moving.
- Measuring speed means observing the distance and the time taken by the object.
Speedometer
- It is an instrument used in vehicles to show the speed with which the vehicle is moving.
- Not all moving vehicles have a speedometer.
Example: A bicycle does not have a speedometer, whereas a car has a speedometer.
- The speedometer has a needle which indicates the speed.

Odometer
- An odometer is a device on vehicles to track the distance covered.
Measurement of Time
- Certain events in nature help us track time.
- Example: The phases of the moon indicate the time of the month.
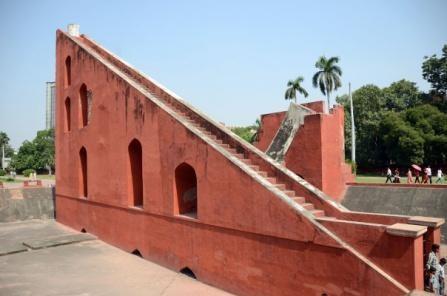
- Man-made structures are also constructed to measure time.
- Example: The Jantar Mantar in Jaipur is a Sun clock which is used to measure the time.
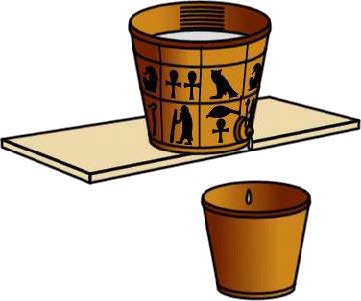
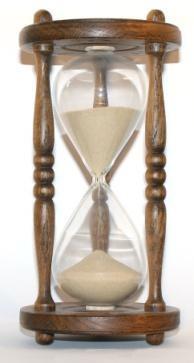
- Water clocks and sand clocks were used hundreds of years ago to measure time.
- The basic unit of time is a second, and it is represented by the symbol ‘s’.
- Larger units of time are minute (min) and hour (h).
- A pendulum is also used to measure time. It consists of a small metal ball called a bob, attached to an inextensible string, which is fixed to a rigid support.
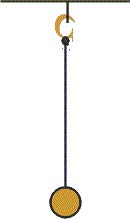
- The length of the pendulum is the distance from the point of suspension to the centre of gravity.
- The time taken by the bob of the pendulum to make one complete oscillation is called its time period.
- If the time period of a simple pendulum is two seconds, then the pendulum is called a second’s pendulum.
Distance-Time Graph
- A distance-time graph is a visual representation of the collected data.
- The graph has a horizontal ‘x-axis’ which represents the time, and a vertical ‘y-axis’ which represents the distance.
- If the line on the graph is horizontal, then it implies that the object is stationary.
- If the line on the graph is straight but with a slope, then the object is moving at a steady speed.

- If the line on the graph is steeper (shown by a blue line), then the speed of the object is greater.
How to Draw Distance-Time Graphs
- We use a graph paper to draw distance-time graph.
- The graph paper has 1 centimetre squares marked on it. Each centimetre square has 100 smaller squares in it (which are millimetre squares).
- The side of bigger square on the graph paper is 1 cm and that of the smaller square is 1 mm.
- To draw the distance-time graph for a moving object, we need a graph paper, and the readings of distances travelled by the object and the corresponding time values which have been obtained experimentally.
- We should draw a horizontal line on the graph paper to represent x-axis. Label the x-axis by writing Time. The unit of time should be written in bracket such as Time (s), Time (min) or Time (h). An arrow should be put in front of the labelling of time and its unit like Time (min).
- Draw a vertical line on the left side of the graph paper to represent y-axis. Label the y-axis by writing the word Distance. The unit of distance should be written in bracket such as Distance (m), Distance (cm) or Distance (km). An arrow should be put in front of the labelling of distance and its unit like Distance (km). The point of intersection of x-axis and y-axis is called ‘origin’ and marked as O.
- We should choose suitable scales so as to represent the large values of ‘time’ and ‘distance conveniently on the small graph paper. The scales to be used depend on the range of time and distance values, and hence vary from question to question.
- Take the first value of time and the first value of distance from the data given in the question and mark one point on the graph paper where the graph lines representing these two values meet. Then take second, third, fourth and fifth sets of values of time and distance and mark corresponding points (as pencil dots) on the graph paper.
- Join all the marked points (or pencil dots) with a pencil line graph to obtain the required distance time graph.
Advantages of distance-time graphs
- The variation of distance travelled by an object with time can be seen more easily from a distance-time graph than from the distance and time values given in the table form.
For example :
- A straight line distance-time graph tells us that the moving object covers equal distances in equal time intervals, so its speed is constant (or uniform).
- A curved line distance-time graph tells us that the moving object covers unequal distances in equal time intervals and hence its speed is not constant (it is non-uniform).
- A straight line distance-time graph parallel to the time-axis (or a horizontal line graph) tells us that the distance moved by the object does not change with time, so its speed is zero (it is stationary)
- The data given in table form may give information about the distance moved by the object only at certain definite time intervals but from a distance-time graph we can find the distance moved by the object at any point of time.
- The speed of an object can be obtained from its distance-time graph. By using distance-time graph, we can find the distance moved by the object between any two time readings. And if we divide this distance by time (given by the difference in the two time readings), we will obtain speed of the object.
Other Types of Graphs
Line graphs show the variation of distance travelled by a moving object (car, bus, truck, etc.) with time.There are two other kinds of graphs.
Bar Graph
A bar graph is a diagram which shows information as bars (thin rectangles) of different heights in a bar graph, the positions and heights of the bars represent the values of the variable quantity about which information is being given.
Pie Chart
A pie chart is a kind of graph or diagram which shows the percentage composition of something in the form of slices of a circle (the whole circle representing 100 per cent).